



Predictive BI Dashboard Development for Enterprise Manufacturing Operations
Industry: Manufacturing | Enterprise Operations | Business Intelligence | Predictive Analytics
Location: Europe
Services Provided
- BI Dashboard App Development,
- Data Engineering & ETL Pipeline Development,
- Predictive Analytics & Forecasting Models,
- System Integration (SAP, CRM, Excel/Spreadsheets),
- Cloud Data Lake Architecture & Deployment (Azure),
- Dashboard Support & Ongoing Model Tuning.
Client Overview
Our client is a European manufacturing enterprise operating multiple production facilities and business units across regions. Their teams managed production lines, machine performance, supply chain coordination, and financial planning using different tools ERP for operations, spreadsheets for reporting, CRM for sales, and separate finance systems.
As operations expanded, leadership needed a single source of truth with real-time visibility into production, machine health, and financial performance.
Business Challenges
Before partnering with Expert App Devs, the client faced critical reporting and operational issues:
- Data scattered across SAP, Excel, and CRM systems
- Manual consolidation of reports across departments
- Delayed decision-making due to non–real-time dashboards
- No unified view of production, finance, and operations
- Inability to predict machine downtime and breakdown risk
- Unexpected production delays and equipment failures
- Reactive forecasting and inconsistent KPI tracking
- High dependency on manual reporting processes
These gaps caused avoidable downtime, missed insights, and planning inaccuracies.
The Big Idea
The client approached Expert App Devs to build an AI-driven analytics dashboard for faster, data-backed decisions.
The goal was simple:
Give leadership, operations, and finance teams one interactive platform to track real-time KPIs and predict downtime before failures happen.
We proposed an enterprise analytics dashboard solution that integrates ERP + CRM + spreadsheet data into a cloud-based dashboard layer with predictive insights.
Solution Overview
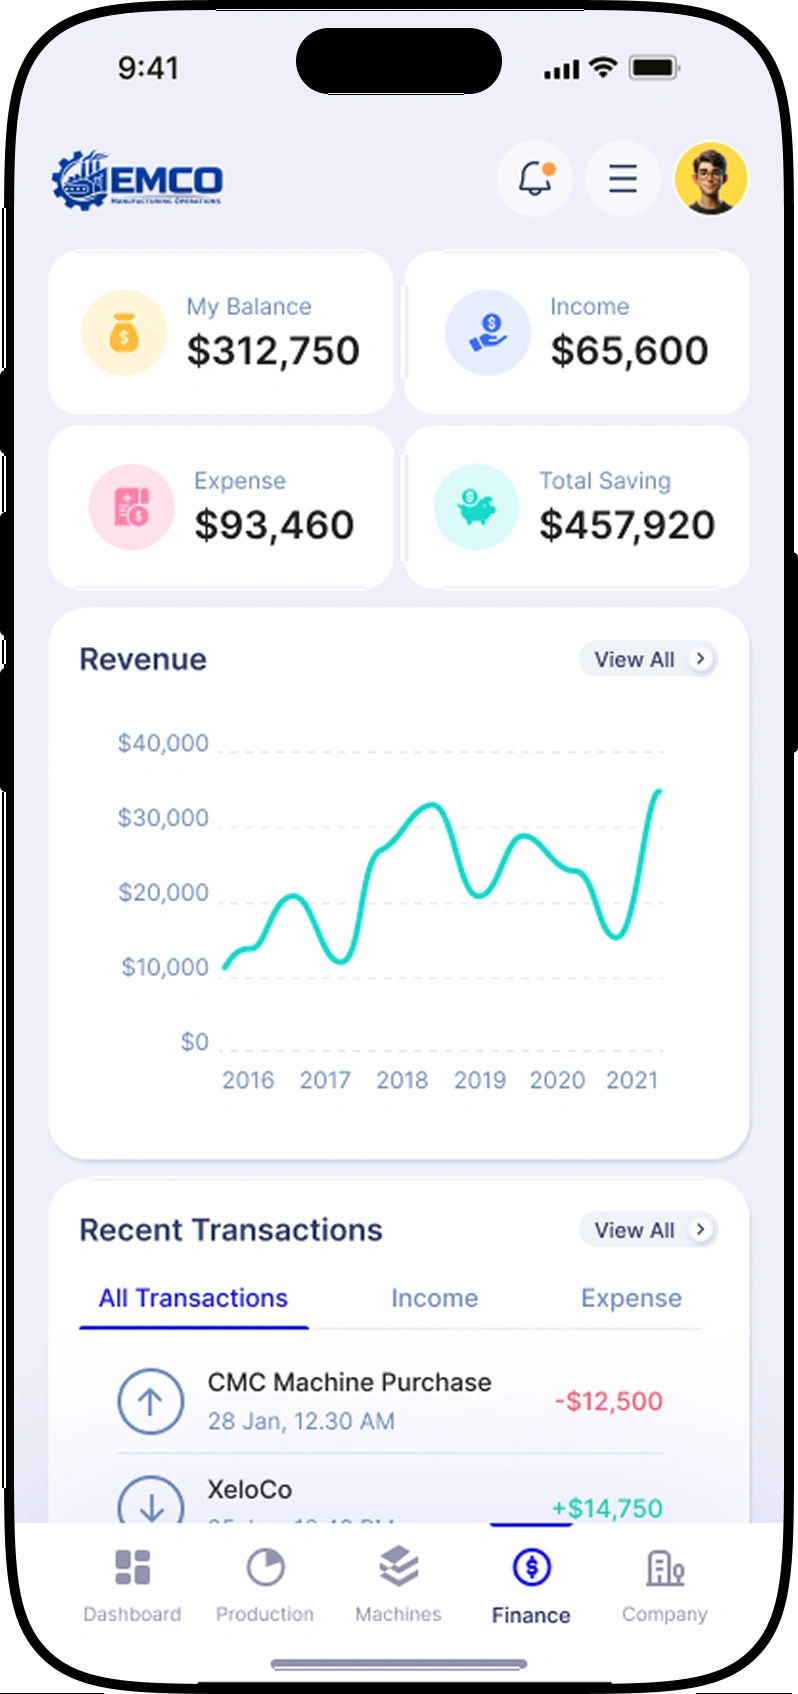
We built a cloud analytics dashboard platform that delivers:
- Centralized data integration (SAP + CRM + Excel)
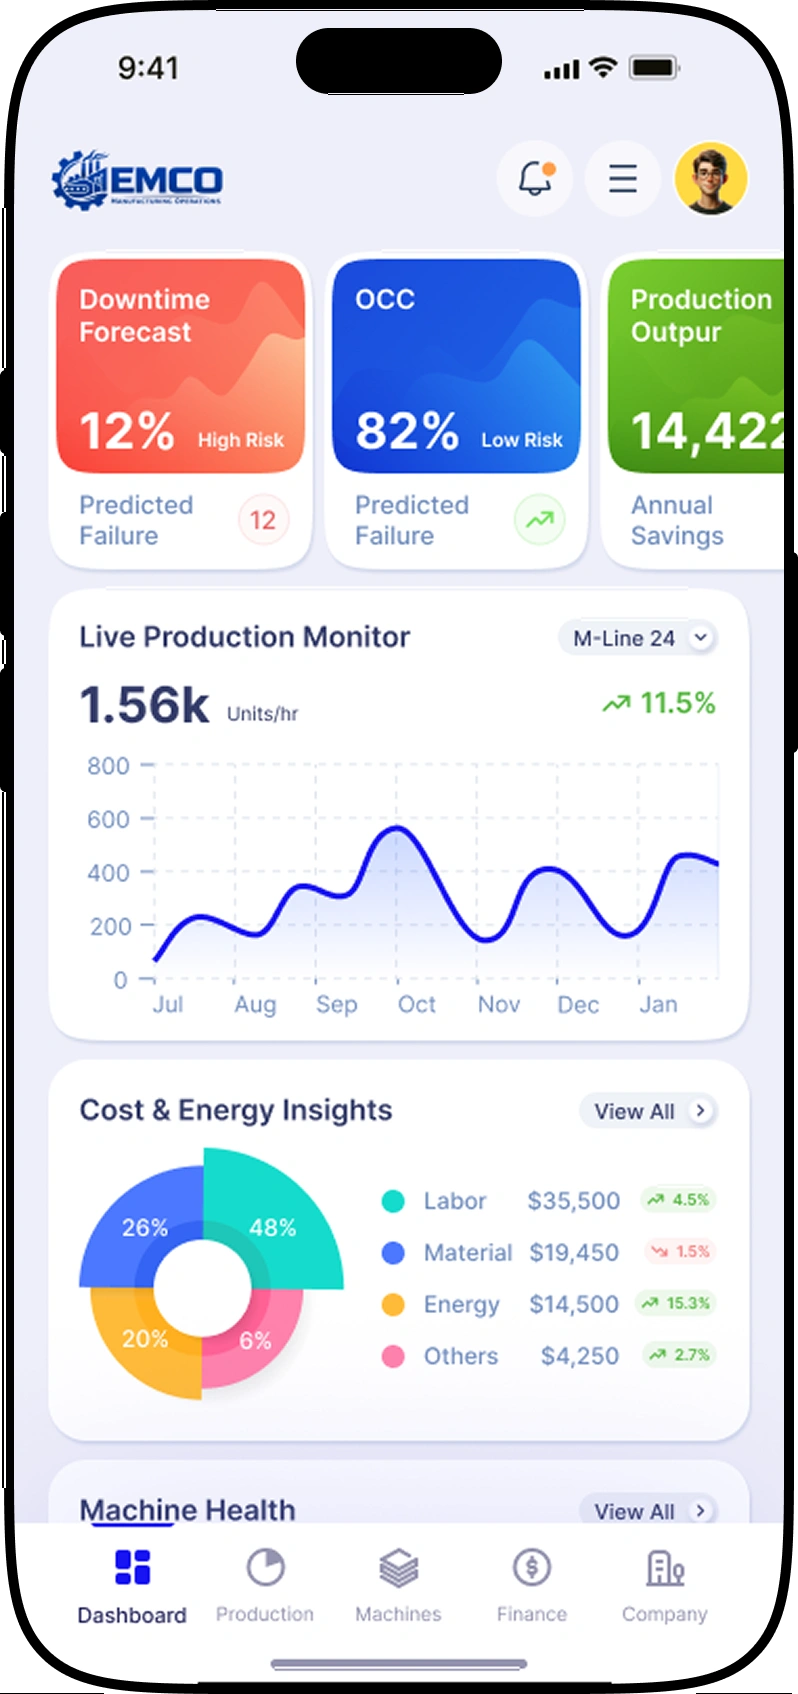
- Real-time performance dashboards for key KPIs
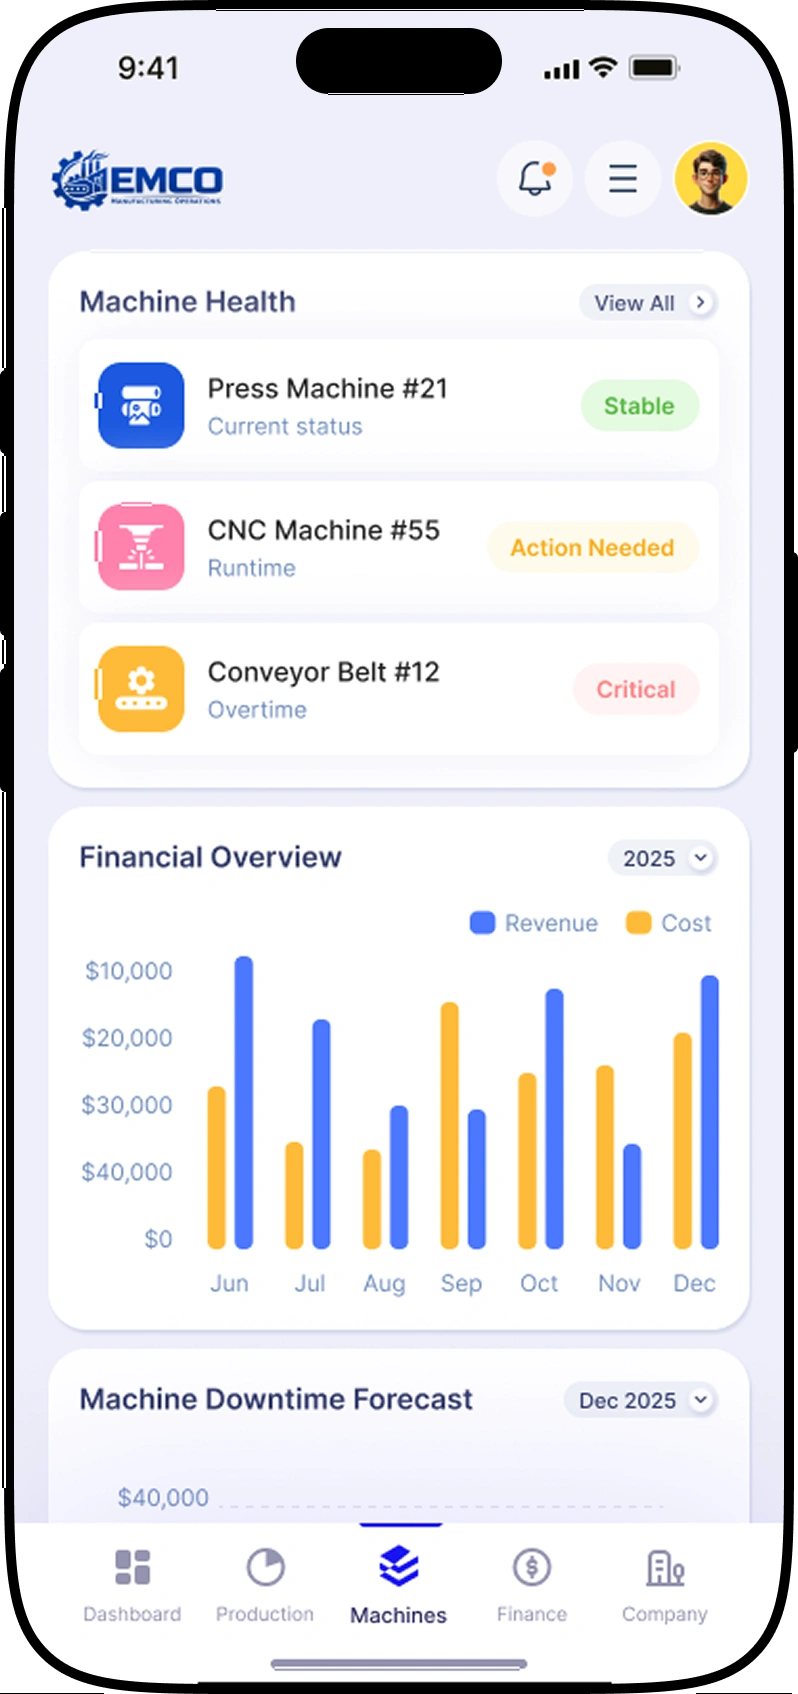
- Production and machine health monitoring
- Predictive downtime alerts using ML forecasting
- Financial and cost tracking dashboards
- Automated report generation for stakeholders
Role-based dashboards ensure each department sees only the metrics relevant to their function (operations, finance, leadership).
Technology Stack
- Frontend / Dashboards: React, Power BI
- Backend: Node.js
- Data Processing: Python (ETL + Machine Learning)
- Data Storage: Azure Data Lake
- Cloud Platform: Microsoft Azure
- Analytics: Predictive models + real-time reporting
- Integrations: SAP (ERP), CRM, Excel/Spreadsheets
- Deployment & Monitoring: Azure DevOps, automated pipelines
Our Development Process
- Discovery & KPI Planning: Mapped data sources and finalized KPIs across production, machine health, and finance.
- Architecture Design: Implemented a data lake + ETL pipeline to handle large datasets from multiple systems.
- Dashboard Development: Built real-time dashboards and interactive drill-down reporting in Power BI and React.
- Predictive Modeling: Developed downtime prediction models using clean historical machine and production data.
- QA & Validation: Validated reports against historical records to ensure consistency and correctness.
- Deployment: Rolled out the solution on Azure with secure access controls and scalable infrastructure.
- Continuous Support: Performed monthly ML tuning and monitoring to maintain prediction accuracy over time.
Challenges
- Disconnected Data Systems: Integrating SAP, CRM, and spreadsheets required normalization across different formats and structures.
- Real-Time Data Visibility: Ensuring dashboards stayed fast while ingesting frequent updates from multiple sources.
- Forecasting Accuracy: Predictive models depended on clean, reliable historical data and consistent machine event logging.
- Dashboard Performance: Handling large data volumes without slow load times or degraded user experience.
- Role-Based Views: Designing dashboards for multiple teams without overwhelming users or exposing sensitive data.
- Readable Visuals: Converting complex operational and financial signals into clear, decision-ready visualizations.
Results & Business Impact
The solution delivered measurable value across operations and reporting:
- 27% reduction in downtime
- 95% data accuracy across unified reporting
- $140K annual savings through optimized operations and resource allocation
- Real-time visibility for leadership with faster, more confident decisions
Final Outcome
By implementing a cloud-based BI and predictive analytics dashboard, the client replaced fragmented reporting with a scalable enterprise analytics platform. Teams now monitor production, machine health, and financial KPIs in real time and receive early warnings before downtime impacts output.
Management now benefits from: Reduced unexpected failures and full visibility into operations.
The enterprise benefits from: Eliminated reporting silos, improved KPI trust, and smarter forecasting.
Looking to Build an AI-Driven Analytics Dashboard?
Expert App Devs specializes in data analytics dashboard development, BI dashboard app development, and predictive insights platforms for enterprise operations.
Let’s build a unified analytics dashboard solution for your business.
Unified Data View
Real-Time Performance Tracking
Predictive Downtime Forecasting
Automated Reports & Scheduled Insights
Interactive Dashboards & Drill-Down Filters
Role-Based Access Control
High-Performance Data Processing
AI-Powered Insights
Gallery

Let's build your next digital product together.
Get Started